Rachael Kluba
As we know by now, RB has had to make financial adjustments and those adjustments have affected class sizes. In part one of this series, teachers expressed how their teaching was affected by the increased class sizes. In part two of the series, students divulged how they have been impacted. However, just because RB is experiencing change, does this mean the school has it bad? What are the actual class size numbers? What about other schools? What are they going through? Are they experiencing the same difficulties as RB, or are they doing better?
In an e-mailed response, Glenbard South High School Assistant Principal Taff Nielson said, “We have worked very hard as a district to stay fiscally responsible and solid.”
After a failed operating fund referendum and a first two rounds of resulting budgetary cuts, RB was slated to run a $920,000 budget deficit for 2011-12. Getting to this number included a reduction of 8.6 FTE from 2011-12 to 2012-13. FTE stands for Full-Time Equivalency, with 1.0 FTE representing a full workload for a single teacher. According to a school board report in November, RB had 94.5 FTE in 2011-12, and has 85.9 FTE in 2012-13. Some unexpected savings on property tax appeals and utility costs turned the projected deficit into a $300,000 surplus.
Regarding class sizes, Timothy Christian Admissions Director Ann Raley said in an e-mailed response, “We try very hard every year to hold the line at 29 students in an academic class with one teacher (so, not counting music performance classes). We don’t always succeed and occasionally have to allow the class to grow to 30 or 31, but that is definitely the exception, not the rule, and many of our academic classes have 25 or fewer students.”
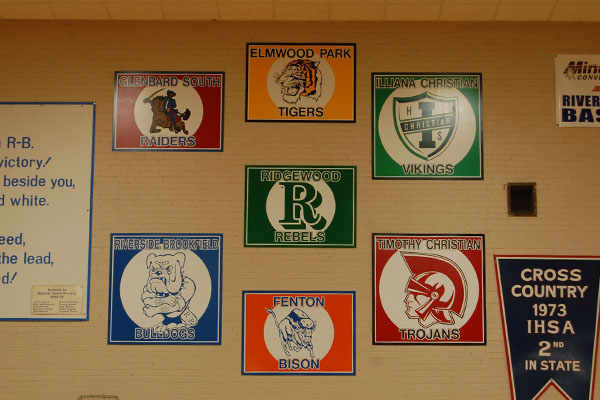
At RB, board policy encouraged a class size of 30:1 for non-lab classes, and the actual average in 2012-13 for these classes in 27.6 students per class, with English and Social Studies carrying the brunt of the load. In comparison, Elmwood Park has an average of 23 students in each class, while Fenton has a lower average of 20 students per class room. Glenbard South and Timothy Christian report averages of 25 students per class.
It is worth noting that RB’s average of 27.6, as indicated in their board report, reflects only those classes which were aimed at being 30:1 in size. Larger classes, like a PE class, and smaller classes, like a self-contained special education class, are excluded from the 27.6 number.
Schools
Average Class Sizes
Riverside Brookfield
27.6
Fenton
20
Elmwood Park
23
Glenbard South
25
Timothy Christian
25
“While our district [Fenton High School] has felt its share of the national, state, and regional economic crunch, our focus has and always will be student achievement while working with a balanced budget,” said Fenton Assistant Principal Pedro Castro in an e-mailed response.
Out of 414 classes at RB, 277 were targeted to be at a 30:1 class size. Of those 277, 93 (33%) exceed 30 students and 25 (9%) have fewer than 20 students. 13 classes have more than 35 students in them, with the largest 30:1 class in the building having 37 students.
# of Students for RB
414 Classes (277 at 30:1)
Over 30 students
93
Under 20 students
25
“Any time class sizes increase, there will be an adverse impact on student learning. Teachers lose that ability to connect individually and the chances to offer more concise feedback diminishes when class sizes bulge,” said Elmwood Park High School Assistant Principal Jim Edwards in an e-mailed response.
What are RB’s staffing and class size plans for the future? In an interview with the Riverside-Brookfield Landmark, Superintendent Kevin Skinkis indicated that RB might look at increasing its staffing by two teachers to maintain current class sizes.
“”We shouldn’t go be trying to go above 30 to 1,” Skinkis said to the Landmark. “If anything, you would like to hang around right below 30 to 1 in all our classes and we have some that are over that.”